Why Principals are turning to Analytics+ in Agentbox
Discover how Principals and Sales Directors are using Analytics+ in Agentbox to access smarter, visual reporting that informs decisions and drives agency growth.

Real-time insight. Visual reporting. No more spreadsheets.
If you’ve ever thought, “There must be a better way to see what’s going on in my business” – you were right.
Most Principals and Directors know their CRM holds the answers. But digging into the data with slow, manual, tabular reports just doesn’t cut it anymore. You either outsource it to a third-party BI tool (that isn’t property-specific) or fly blind and hope for the best.
That’s why we built Analytics+ in Agentbox.
It’s not just another reporting tool. It’s business intelligence made visual, simple, and useful – designed specifically for real estate sales agencies.
What is Analytics+?
Analytics+ is an advanced reporting platform built inside Agentbox to help Sales Principals and Directors:
- Get a clear picture of what’s happening in their agency – fast
- Make informed, strategic decisions using live CRM data
- Identify sales trends, team performance, and market opportunities at a glance
Whether you want a high-level overview or need to drill down into the details, Analytics+ gives you the flexibility to customise, filter, and slice the data any way you need.
Watch this video to see it in action.
What can you track?
You’ll get access to a suite of easy-to-read, customisable dashboards and charts that help you track:
- Sales velocity: How fast stock is turning over
- Revenue performance: Understand which channels and campaigns are delivering
- Agent performance: Leaderboards, commission tracking, activity volume
- Property insights: Spot underperforming listings, map demand hotspots
And you don’t need to be a data analyst to use it – the reports are visual, intuitive and made for agency leaders.
It’s a single source of truth that’s built for the way real estate works.
Why Principals are switching toAnalytics+
Here’s what makes Analytics+ standout for agency leaders:
- No more spreadsheets. Say goodbye to manual exports and static reports.
- Customisable dashboards. Choose the KPIs and visuals that matter most to you.
- Visual storytelling. See trends play out in map views, bar charts, and drill downs – not just tables.
- Strategic clarity. Track results, spot gaps, and align your team with data-backed decisions.
Common objections? We’ve heard them all.
- Thinking “we already use a third-party tool”? That tool probably wasn’t built for real estate.
- Worried about adoption? The interface is clean and easy to use – no steep learning curve.
- Budget holding you back? We get it. But the real cost is the opportunity you’re missing by not knowing where your listings, leads, or team efforts are falling short.
- And if you’re concerned about data security? Don’t be – it’s all built within the trusted Agentbox system.
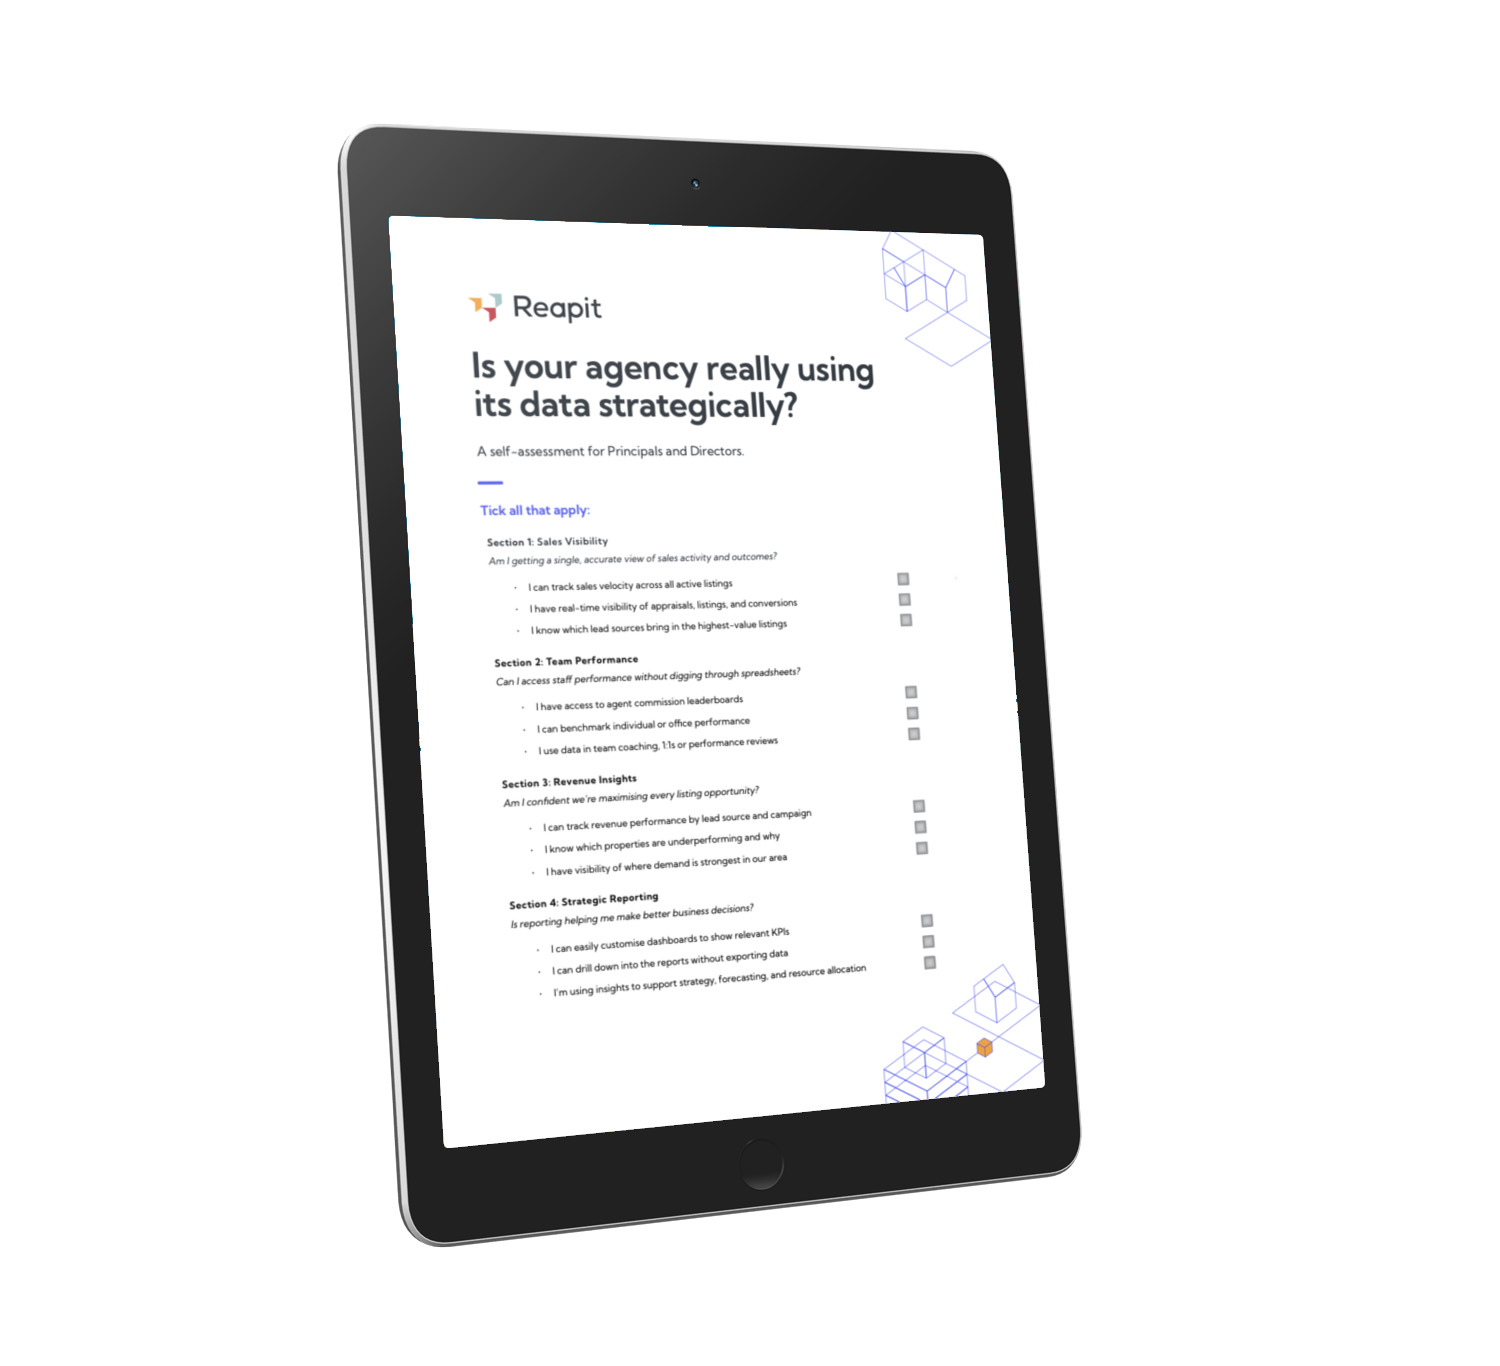
Not sure where to start? Use our free checklist.
We’ve created a quick self-assessment to help you see where your agency stands.
- Do you know which lead sources convert best?
- Are you across your team’s follow-up performance?
- Can you identify sales bottlenecks before they hit revenue?
Click the image below, and don’t forget to scroll down to page 2 to see how your agency scores!
→ Or book a walkthrough with our team to see Analytics+ in action.
Make decisions with confidence
In a shifting market, visibility is power.
Analytics+ helps you get clear on what’s working, where your team needs support, and how to move the business forward – with data that’s easy to generate, interpret, and act on.
It’s more than just reporting – it’s the intelligence that propels your agency’s growth.


